
Thursday, July 23, 2015
Thursday, February 19, 2015
Oracle Analytical Queries Examples
This post as nothing to do with Tableau, here my intention is only to create repository of Oracle Analytical Queries.
1) OVER PARTITION BY :
cOMPANY Weeknum TDATE OPENPRICE HIGHPRICE LOWPRICE CLOSEPRICE
IIMLC 27 30-JUN-2014 123.4 25.8 23.4 25.05
IIMLC 27 01-JUL-2014 25.3 25.85 24.9 25.05
IIMLC 27 02-JUL-2014 25.75 26.4 25.35 25.5
IIMLC 27 03-JUL-2014 25.55 25.75 24.95 25.25
IIMLC 27 04-JUL-2014 25.25 25.7 24.65 25
Above are the Records in dummy table, Our task is to create out as given below:
it as daily average (AVG=(highPrice+lowprice)/2) and weekly average of close (Weekly avg(closeprice)) in all rows
cOMPANY Weeknum TDATE OPENPRICE HIGHPRICE LOWPRICE CLOSE AVG WEEKLY
IIMLC 27 30-JUN-2014 123.4 25.8 23.4 25.05 24.6 25.17
IIMLC 27 01-JUL-2014 25.3 25.85 24.9 25.05 25.3 25.17
IIMLC 27 02-JUL-2014 25.75 26.4 25.35 25.5 25.8 25.17
IIMLC 27 03-JUL-2014 25.55 25.75 24.95 25.25 25.3 25.17
IIMLC 27 04-JUL-2014 25.25 25.7 24.65 25 25.1 25.17
Solution Query:
SELECT COMPANY,TDATE,to_char(TDATE,'IW')
WEEKNUM,OPENPRICE,HIGHPRICE,LOWPRICE,
CLOSEPRICE,(HIGHPRICE+LOWPRICE)/2 AS DAILYAVG,
ROUND(AVG(CLOSEPRICE) OVER (PARTITION BY to_char(TDATE,'IW')),2) WEEKLYAVG,
FROM MARKETMOVEMENT;
Explanation: In above query
AVG(CLOSEPRICE) OVER (PARTITION BY to_char(TDATE,'IW')
This line is doing all the work for us it is actually calculating the average by partitioning the out on the basis of the week number to get the weekly average.
Click more about Oracle Analytic functions
Tuesday, February 17, 2015
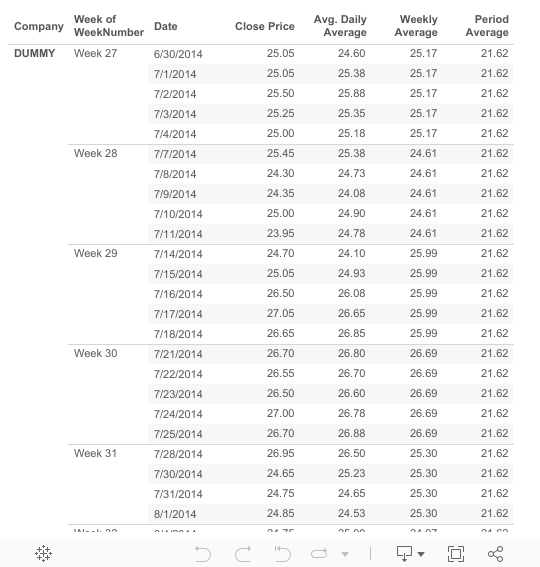
Window and Pan Calculation a Small Example
This work sheet contains short example how & where to use Window and Pan in Table calculation of Tableau.
It show the market movement for a share value of a dummy company
Weekly average = WINDOW_AVG calculation on closing price computed on Pan(down) for Week Number pan
Period average = WINDOW_AVG calculation on closing price for Table(down)
It show the market movement for a share value of a dummy company
Weekly average = WINDOW_AVG calculation on closing price computed on Pan(down) for Week Number pan
Period average = WINDOW_AVG calculation on closing price for Table(down)
Thursday, January 8, 2015

All India Pincode Search
Postal
Index Number (PIN) or PIN Code is a 6 digit code of Post Office
numbering used by India Post. The PIN was introduced on August 15, 1972.
There are 9 PIN regions in the country. The first 8 are geographical
regions and the digit 9 is reserved for the Army Postal Service. The
first digit indicates one of the regions. The first 2 digits together
indicate the sub region or one of the postal circles. The first 3 digits
together indicate a sorting / revenue district. The last 3 digits refer
to the delivery Post Office.

Wednesday, January 7, 2015

The Purpose of this visualization is to show how to pass the URL dynamically to the web page
component of Tableau dashboard.
Problem Statement : Need to know Nobel laureate once a user clicks on the person name
Solution:
Step 1: Create calculated field named URL with
"https://en.m.wikipedia.org/wiki/"+TRIM(REPLACE([Person],"*",""))
Step 2: Add web page on dashboard and also added the list work sheet to dashboard
Step 3: Add Hyperlink action on main dashboard applied on list work sheet and in URL text box put the
calculated field <Url>
Subscribe to:
Comments (Atom)